IB Diploma Economics:
|
|
Calculations of GDP
Calculating Nominal GDP using national Income data
The expenditure approach
Using the expenditure method to calculate nominal GDP from national income data
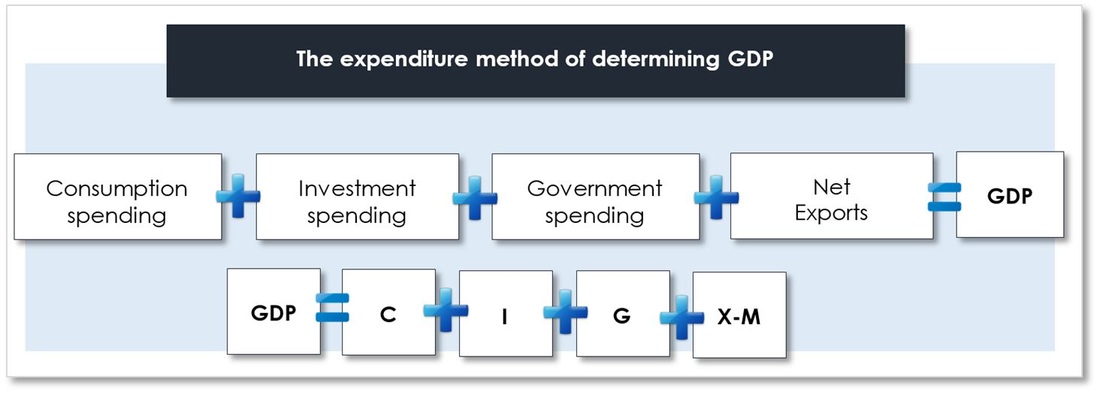
An advantage of using the Expenditure Method is data integrity. Most countries consider the source data for expenditure components to be more reliable than for either income or output components. To determine GDP, total expenditure sums the following forms of economic expenditure:
Calculating Contribution to GDP
Calculation of a specific contribution to GDP (e.g., government expenditure) – step-by-step:
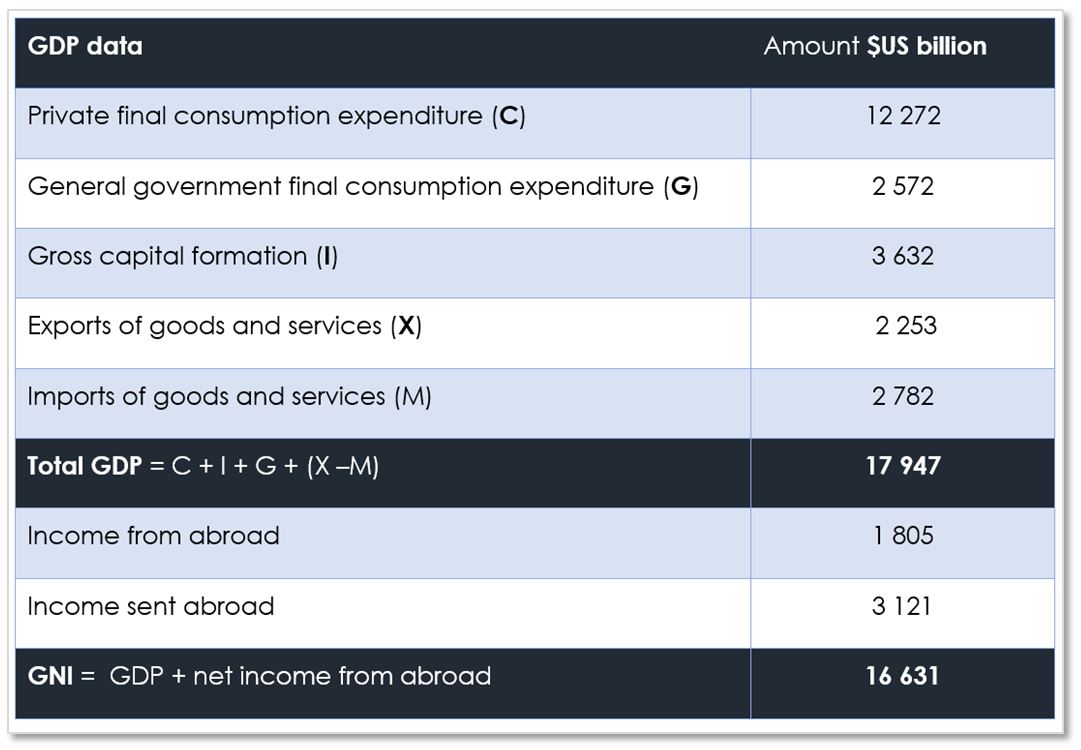
Government expenditure accounted for 14.33% of US GDP in 2015.
|
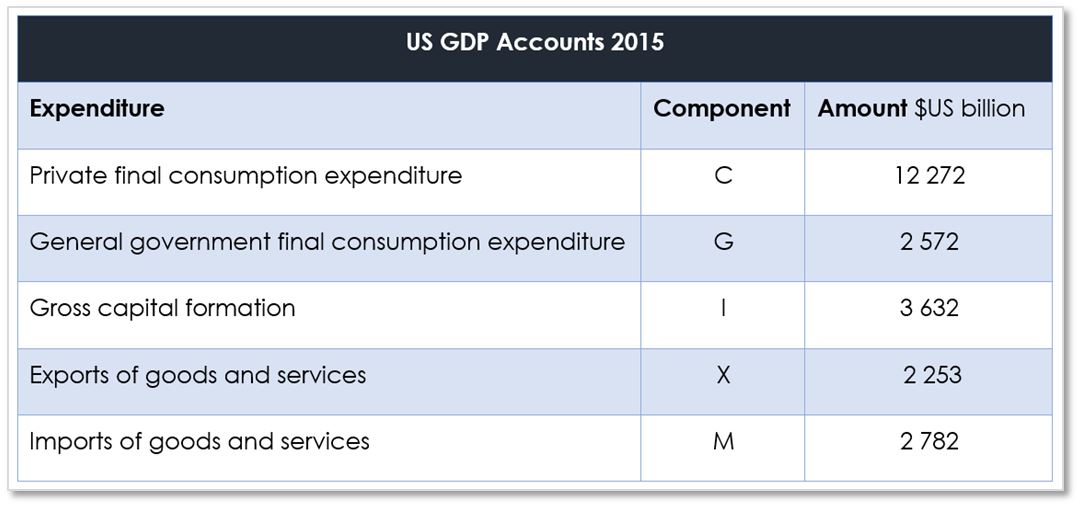
Data in the national accounts makes it fairly straightforward to identify each of the individual expenditure components, and the IB Economics exam will not overly complicate things. Once you have identified each component in the data, the calculations are simple addition. Take for example the national account data shown in figure 1 below, which lists the US national expenditures for the 2015.
Calculating nominal GDP, for the US in 2015 is laid out below, step-by-step:
Factor income contributions
Using the income method to calculate contributions to GDP from national income data
IB Economics doesn’t require students to calculate total GDP using the income approach. However, you may be asked in your HL Paper 3 exam to calculate the relative percentage contribution that a factor income makes to a country’s GDP. Thus, from a table listing the national income earned from the factor incomes (wages, rent, interest and profit), you will need to know how to provide the percentage contribution. Take for example, wages:
Income derived from the labour factor of production, accounted for 41.72% of US GDP in 2015.
|
What is Inflation?
|
Nominal and Real GDP |
Calculating real GDP, using a price deflator
|
Nominal GDP is the value of the total output of final goods and services at current market prices, within a given year. As we know, prices will often increase each year due to inflation – a sustained increase in the general price level.
From the expenditure method of calculating GDP, we know that GDP = the price paid for goods and services and the quantity purchased. If prices in the economy increase by 10% on average (inflation), then GDP will increase by 10% if the quantity of goods and services remain constant. Nothing extra has been produced or consumed. No one in the economy is actually better off, but if you look at nominal GDP it appears that economic activity is increasing. Real GDP adjusts for the effects of inflationary price rises to give an accurate picture of how much an economy is producing, how high incomes really are, and how many goods and services are being consumed. Real GDP gives us a much better picture of the standard of living within an economy. An increase in real output can arise from increases in foreign direct investment, productivity and/or international competitiveness. Thus, real GDP will provide economists with an insight into the true level of economic activity. Real GDP: Refers to nominal GDP adjusted for prices changes relative to some base year. It is changes in real GDP that allows us to measure economic growth in real terms or increases in the standard of living. Real GDP = nominal GDP – inflation A GDP deflator is used to account for inflationary effects within the GDP data. The GDP deflator (implicit price deflator) is a measure of the level of prices of all new, domestically produced, final goods and services in an economy. The index reduces (deflates) nominal GDP to a value that represents the actual value of the output. GDP deflator = base year index (usually 100) + rate of inflation |
Real GDP
The GDP Deflator
|
Step-by-Step: Calculating Real GDP - Nominal GDP and Inflation Data
Step-by-step: Calculating real GDP given just nominal GDP and inflation data (which is as hard as it gets in IB Economics!)
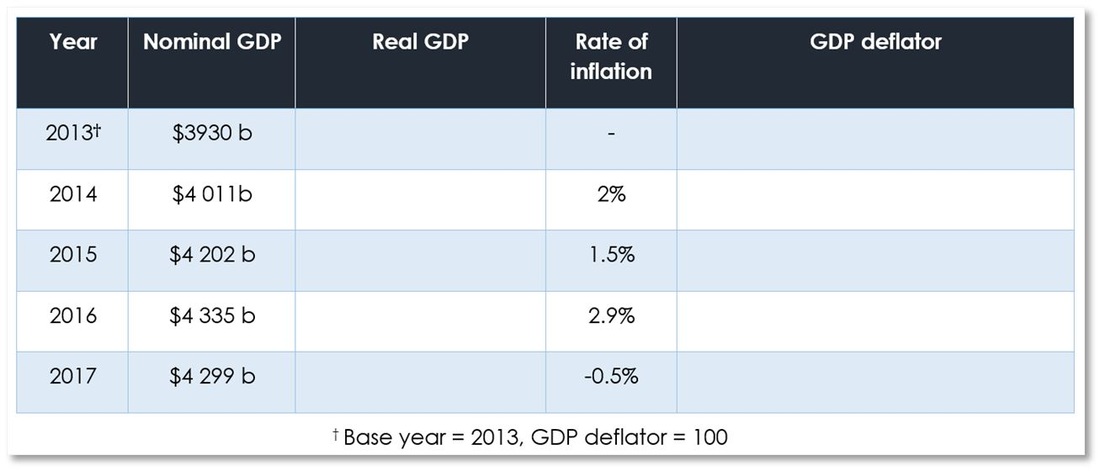
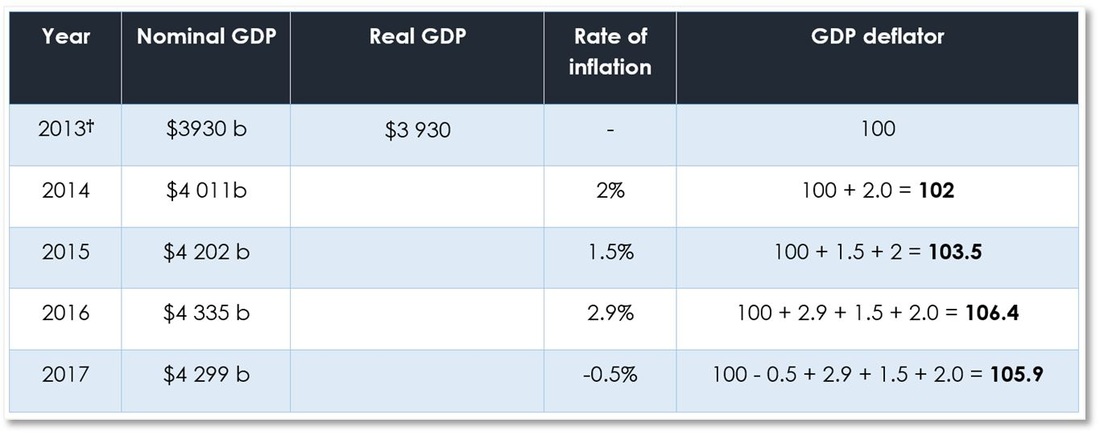
1. Information provided: nominal GDP and inflation figures per year
1. Information provided: nominal GDP and inflation figures per year
2. Calculate the GDP deflator for each year; 2013 is the base year (deflator = 100)
Across the years, the rate of inflation is accumulated in the GDP deflator calculations. So, in the example above, in the first year it is 2.0%, in the next year 2.0% + 1.5%, the following year, 2.0% + 1.5% + 2.9%, and so on …
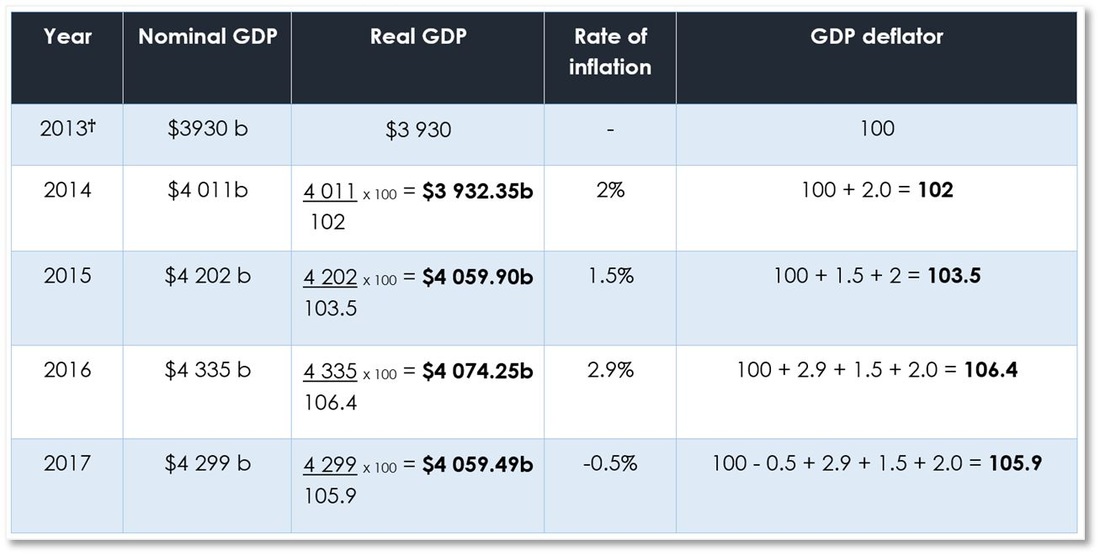
3. Calculate real GDP using the deflator
Use the formula above to calculate real GDP for each year. You will note that in 2017, prices in the economy fell (deflation), which resulted in a lower GDP deflator being used than in 2016.
Calculating real economic growth
Calculating real economic growth
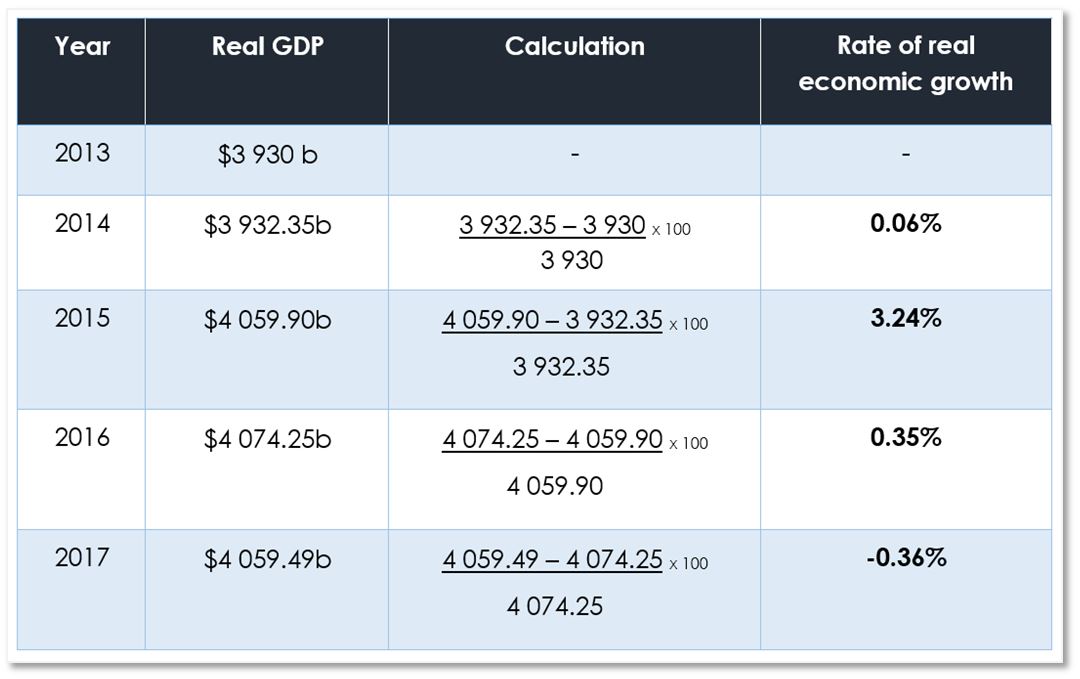
Having determined real GDP, we can now easily calculate the rate of economic growth in the economy. We do this by finding the percentage change in the value of GDP. We can see that this economy is not experiencing much in the way of increased economic activity. 2015 was a relatively good year, and the economy expanded the value of its economic output by 3.25% which is a good rate for a developed economy in this time period. 2014 and 2015 had very low levels of economic growth which would have been a concern to the government. In 2017, the economy went backwards and produced a lower value of total output, and real national income declined.
The HL IB Economics exam may ask you to calculate real growth across more than a single year, and the calculation is exactly as above. |
Economic Growth
Long-term economic growth
|
IB Economics 2.3 Calculating GDP HL
Summary Notes
IB Economics - 2.3 Calculating GDP teaching and learning PowerPoint notes for HL IB Diploma Economics.
IB Economics
2.3 Calculating GDP hl Video Tutorial
PROGRESS CHECK - TEST YOUR UNDERSTANDING BY COMPLETING THE ACTIVITIES BELOW
You have below, a range of practice activities, flash cards, exam practice questions and an online interactive self test to ensure you have complete mastery of the IB Economics requirements for the Macroeconomics – The Level of Overall Economic Activity: 2.3 Calculating GDP topic.
IB Economics interactive QUIZZES AND TWO CLASSROOM GAMES
|
Test how well you know the IB Economics Macroeconomics – The Level of Overall Economic Activity: 2.3 Calculating GDP HL topic with the interactive self-assessment quizzes below. Aim for a score of at least 80 per cent.
|


