IB Diploma Economics:
|
|
Learning outcomes for the Demand topic in IB Economics:
- Outline the meaning of the term market.
- Explain the negative causal relationship between price and quantity demanded.
- Describe the relationship between an individual consumer’s demand and market demand.
- Explain that a demand curve represents the relationship between the price and the quantity demanded of a product, ceteris paribus.
- Draw a demand curve.
- Explain how factors including changes in income (in the cases of normal and inferior goods), preferences, prices of related goods (in the cases of substitutes and complements), and demographic changes may change demand.
- Distinguish between movements along the demand curve and shifts of the demand curve.
- Draw diagrams to show the difference between movements along the demand curve and shifts of the demand curve.
- Explain a demand function (equation) of the form Qd = a – bP. HL
- Plot a demand curve from a linear function (e.g. Qd = 60 – 5P). HL
- Identify the slope of the demand curve as the slope of the demand function Qd = a – bP, that is − b (the coefficient of P). HL
- Outline how a change in ‘b’ affects the steepness of the demand curve. HL
- Outline why, if the ‘a’ term changes, there will be a shift of the demand curve. HL
The nature of markets
|
A market is any arrangement that allows buyers and sellers of goods and services and resources to be linked together and exchange things.
A market is a place where sellers and buyers gather together to trade money for goods or services. They do not necessarily get together face to face. Products may be purchased by consumers and offered by suppliers at online marketplaces like Amazon and eBay. The amount paid to the supplier by the consumer in return for a product is known as the price. There are different markets associated with each of four factors of production. For instance, there exists a market for a workforce (laborers). The workforce is required by manufacturers to produce goods. The manufacturers are the purchasers of labour and individuals are the sellers of their own personal labour. |
Markets are diverse. Buyers and sellers may decide to meet face-to-face to make an exchange, such as customers exchanging money for goods in a supermarket. Markets may be virtual such as Amazon's market place and consumers and suppliers are never likely to meet. Markets can be local, national and international. Product markets facilitate the exchange of goods and serves.
Factor markets or resource markets are where the factors of production are exchanged.In IB Economics, competition is a rivalry between businesses trying to sell products to consumers in market, and to consumers trying to purchase goods and services in that same market. Competitive markets are markets composed of large numbers of sellers and buyers acting independently, so that no one individual seller or small group of sellers has the ability to control the price of the product sold. Here market prices are determined by the forces of supply and demand, which is what we turn our attention to next. |
Demand: Understanding the law of demand and the demand curve
The law of demand
|
Quantity demanded
|
relationship between price and quantity demanded
|
Quantity demanded is the amount of a good or service that a consumer is willing and able to purchase at a given price within a certain period of time. Demand implies that consumers must not merely wish to purchase the product, but also possess sufficient funds to be in a position to purchase it, and that the amount demanded is calculated over a certain time period (e.g., daily, monthly and yearly). Effective demand is the amount of a good people are willing to buy at given prices over a given period of time backed by the ability to pay.
The law of demand says that as the price of a good or service increases, the quantity demanded decreases, and vice versa for a decrease in price, assuming ceteris paribus. Ceteris Paribis: "Other things being equal"; used as a reminder that all variables other than the ones being studied are assumed to be constant. There is an inverse or negative association between price and quantity demanded. The two main effects on quantity demanded of price changes that describe the negative relationship: the substitution effect and the income effect. Essential statement: The law of demand is explained by the substitution and income effects. The inverse relationship between price and quantity demanded arises because price changes trigger substitution and income effects and change the quantity demanded of a good or service. |
The substitution effect
If can of Coke increases in price, then a can of Pepsi becomes relatively less expensive. A substitute is a product you can use instead of a different product. If the price of a product declines it would be less expensive compared to the alternate product resulting in some customers deciding to purchase the product instead of the substitute. When the price of a product increases, it would be comparatively more costly compared to the alternate product resulting in some customers purchasing the alternate good. Changing the price consequently results in a change in the amount demanded. The income effect As the price declines, the amount of the product which can be purchased using the same money rises. Consequently, when the price declines quantity demanded also increases. If the price rises, the amount of the product which can be purchased using the same money declines. Hence, when the price goes up, quantity demanded drops. Income and substitution effect |
The substitution effect |
The income effect |
Individual consumer demand and market demand
|
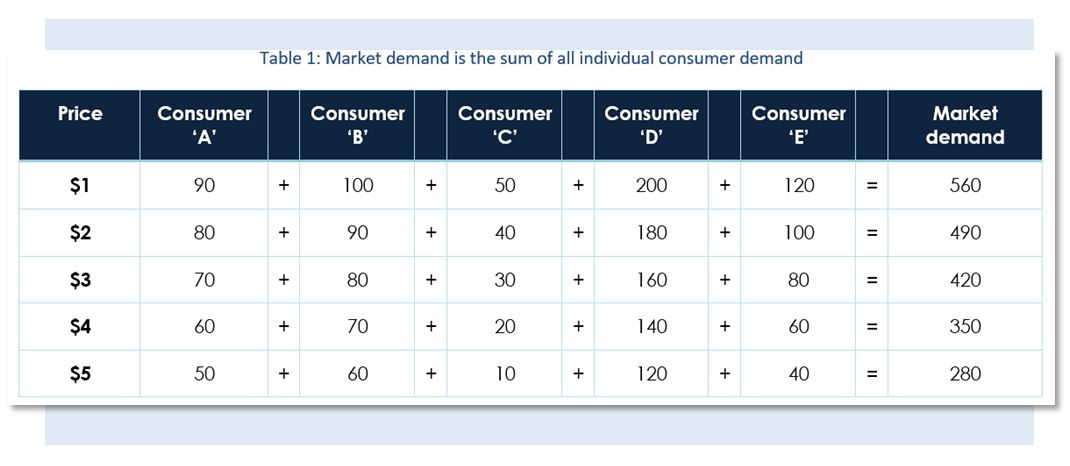
A demand schedule is a table that lists the quantity of a good a consumer is willing and able to buy at a range of different prices. This information can then be used to construct an individual's demand curve.
Assume five consumers make a market. Table 1.1 shows the quantities demanded by the five consumes at a range of different prices. Market demand is the sum of all individual consumer demand in the market for a good or service. |
Click to enlarge
|
The demand curve
A demand curve represents the relationship between price and quantity demanded, ceteris paribus.
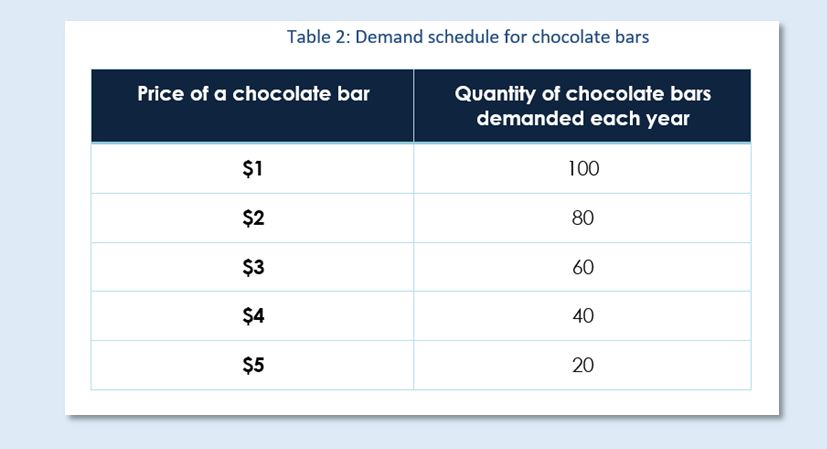
Ceteris paribus means "Other things being equal" and it is used as a reminder that all variables other than the ones being studied are assumed to be constant. The quantity demanded at each price is shown in the demand schedule. Changes in the price of a good or services result in changes in the quantity demanded. The quantity demanded of a good or service at each price is shown in the demand schedule see table 2). One of the determinants of demand is price. Changes in price lead to changes in the quantity demanded.
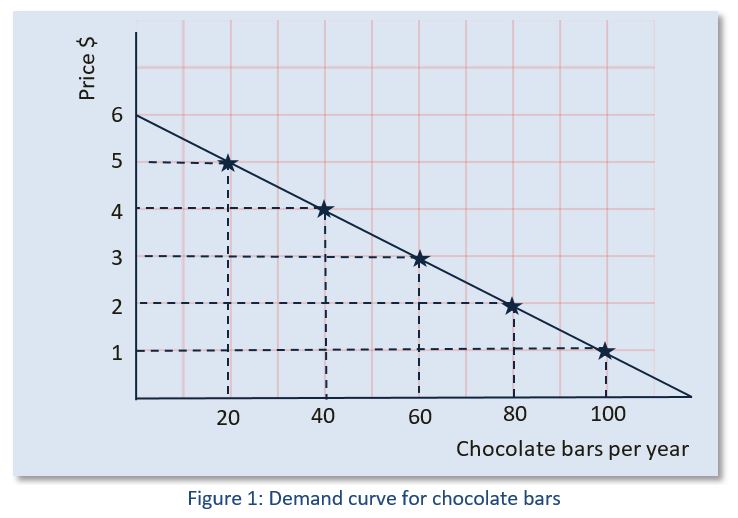
The demand curve is a graph of the relationship between the price of a good and the quantity demanded, ceteris paribus, see Figure 1. It is constructed by using the price and quantity information found in the demand schedule. Price and quantity demanded information are plotted on a graph where price is always on the X axis and quantity demanded on the Y axis. |
|
A change in demand vs a change in quantity demanded
|
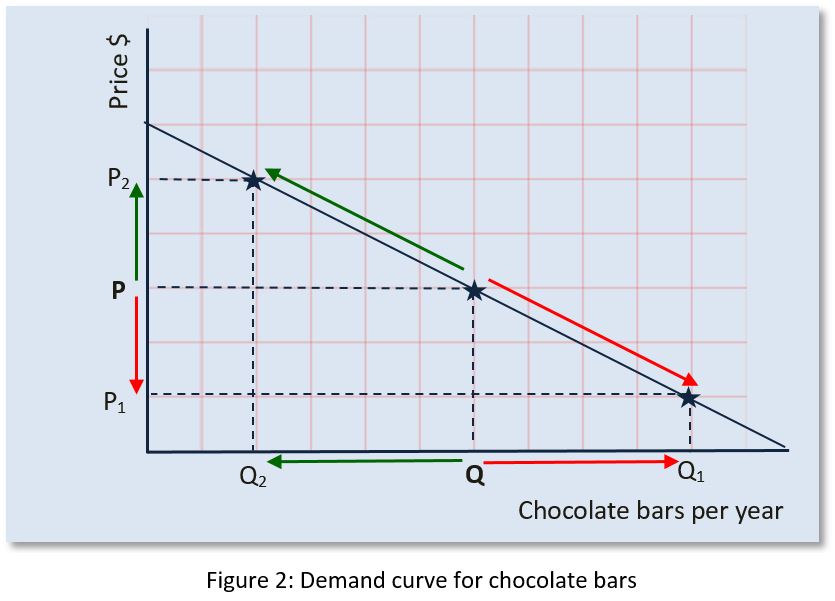
A price change results in a movement along the demand curve
Changes in the price of a good or service results in a change in the quantity demanded and results in a movement along the demand curve see Figure 2). A rise in price brings about a decrease in quantity demanded as well as an upward movement along the demand curve. A drop in price triggers an increase in quantity demanded along with a downward movement along the demand curve. It is only a price change that results in a movement along the demand curve. Essential statement: Ceteris paribus is all other things are assumed to be constant. Thus, to isolate the effects of a price change on the quantity demanded, all of the other determinants of demand are held constant. The non-price factors that will determine demand and can cause a shift of the demand curve
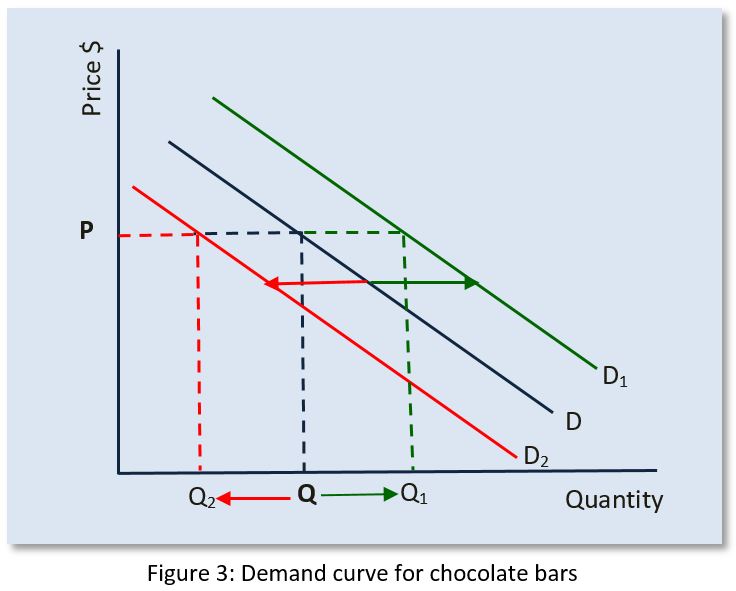
The demand curve itself can shift left (decreased demand) or shift right (increased demand). See figure 3 below. The four factors that determine demand, and thus, increase or decrease demand are:
Essential statement: A change in quantity demanded is only caused by a change in the price of a good or service, and is shown by a movement along the demand curve. A change in demand shifts the demand curve up (an increase) and right or down and left (a decrease) and is only caused by a change in one or more of the factors that determine demand. Concepts of Demand
|
Factors affecting demandQuantity demanded vs demand
Income
Normal goods are goods and services for which demand increases as consumers' income increases and for which demand goes down when income is lower. Examples include new cars and holidays. Demand for normal goods will increase as consumers’ income increases. The demand curve shifts up and right to illustrate that more of the good or service is required at each price. Inferior goods are those goods and services for which demand tends to fall when income rises. Examples would include used cars and cheaper cuts of meat. Demand for inferior goods decreases when income increases. The demand curve moves down and left to indicate less is required at each price. Every buyer responds in different ways to an adjustment in income. A good or service that is considered ‘inferior’ for one individual might not be for another. Preferences, tastes and fashion As goods and services become more desirable demand grows. The demand curve moves up and right to indicate that quantity demanded also increases at each price, and when it gets to be less desirable, demand declines. The demand curve moves down and left to indicate that less is demanded at each price. For example, as Apple’s iPhone became preferred by a large segment of consumers, demand for it increased (the demand curve shifted right). Conversely, as Blackberry phones fell out of favour, demand for their phones decreased (the demand curve shifted left). The price of related goods Substitutes are products you can use instead of a different good or service (e.g., Coke and Pepsi are substitutes, so too are petrol and public bus rides. A rise in the price of petrol results in a rise in quantity demanded of bus rides at each price and the demand curve for bus rides moves up and right. Complements are products that are used and consumed with each other (e.g., smartphones and apps). Once the cost of smartphones falls the quantity demanded of this good increases. Extra apps are then sold. Demand for apps increases as the price of smartphones decreases. Additional apps are required at each fall in the price of smartphones, and the demand curve for apps moves up and right. Demographic changes These are variations in the attributes of the population (size, age. Proportion of women in the workforce). As the population grows quantity demand for the majority of products rises at each price and the demand curve shift up and right. |
The demand function (equation)
An equation that lets you know how a variable like demand is determined is called a linear function, if it produces a straight line when it is graphed. The demand function takes the form Qd= a – bP, and this states how the price (P) of a good or service determines the quantity demanded (Qd). Some basics:
- Qd = quantity demanded
- a = the quantity demanded when the price = 0 (because b x 0 = 0)
- P = price
- b = Tells us how steep the demand curve will be. It is the coefficient that determines the slope of the demand curve (from steep to flat), and measures how responsive the change in quantity demanded is to changes in the price. Sometimes a small price change can produce a large change in quantity demanded because, perhaps, there are a large number of substitute goods the consumer can switch to. Sometimes a large price change will only result in a small change in Qd because, perhaps, the good is a necessity such as petrol. b is always negative because, as we have seen, there is an inverse relationship between price and the quantity demanded – the law of demand (i.e., as P increases, Qd decreases, and as P decreases, Qd increases)
Calculating the Quantity Demanded from a Demand function
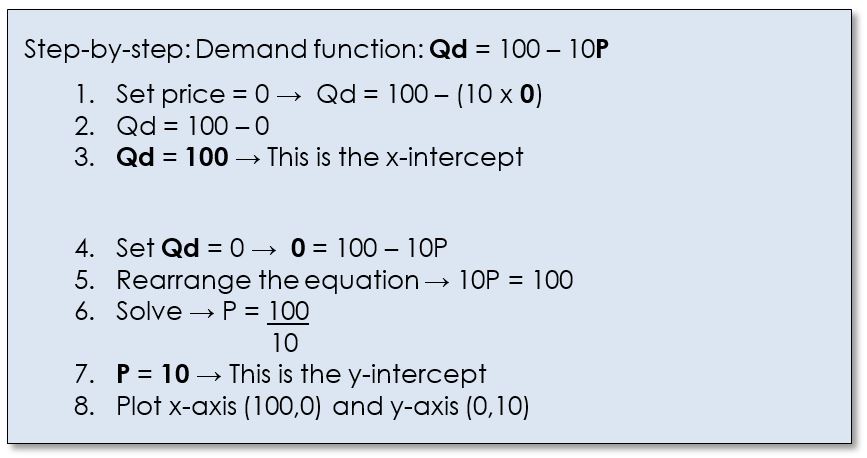
Using the demand function to calculate the quantity demanded when the price is $5:
- Qd = 100 – 10P (10P means 10 multiplied by the price)
- Qd = 100 – (10 × P) → (10 × P in brackets because you need to calculate this first.)
- Qd = 100 – (10 × 5) → Simplify by multiplying 10 by 5
- Qd = 100 – 50 → Simplify by subtracting 50 from 100
- Qd = 50
Using the demand function to construct a demand schedule
|
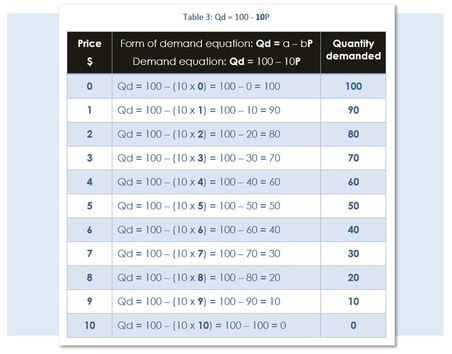
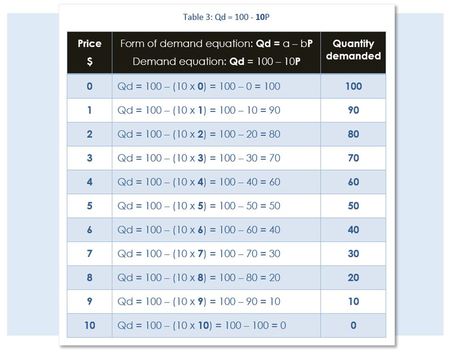
Given the demand function, we can create the demand schedule by simple substitution (see table 3 below).
|
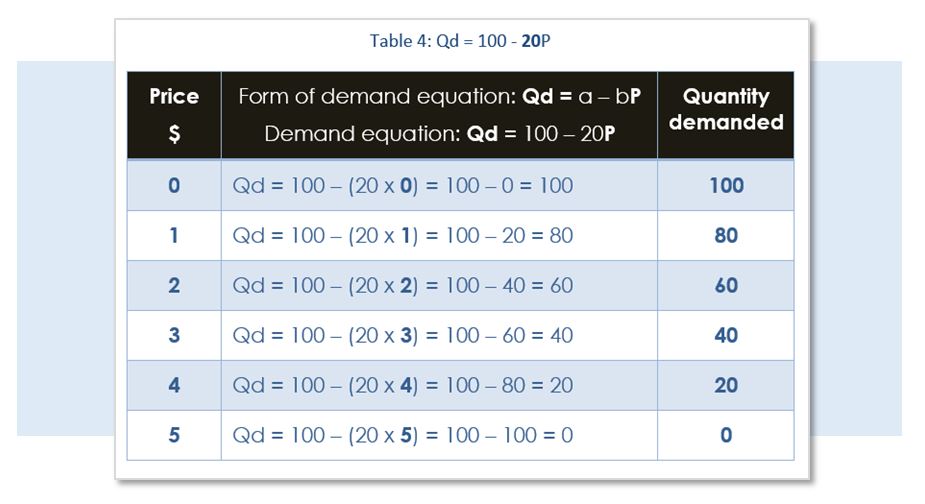
If the demand function for a particular good or service was twice as steep; i.e., 20 for b, instead of 10 as in the table above), the quantity demanded would be twice less responsive to changes in price (as shown in table 4, below). Thus, quantity demanded would fall twice as fast.
|
|
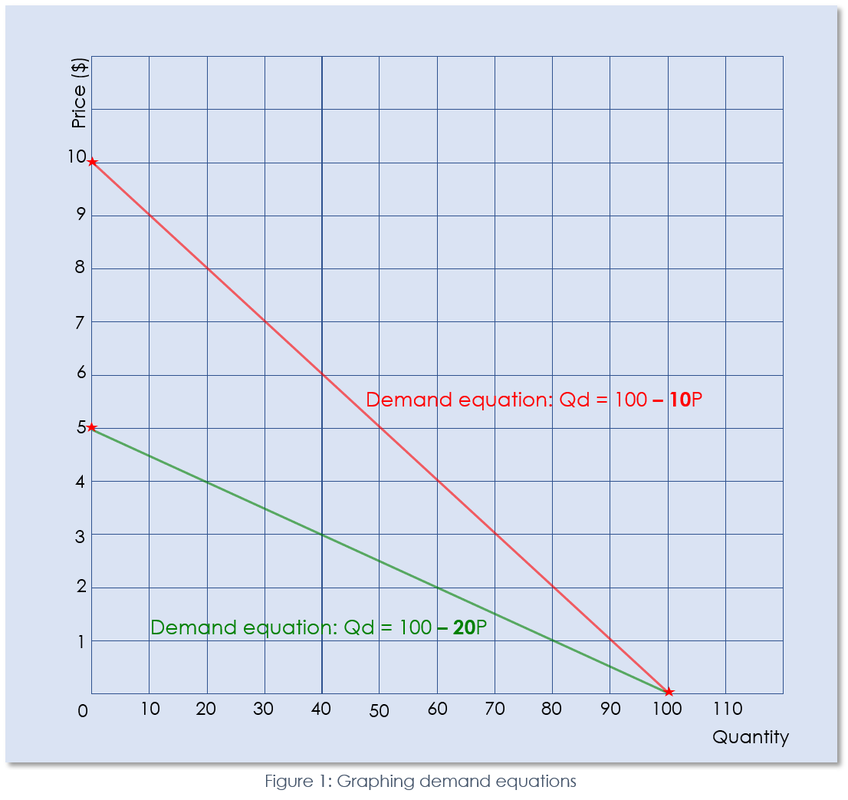
In Figure 4 left, we see the two demand schedules associated with both demand functions: Qd = 100 – 10P and Qd = 100 – 20P.
Quantity demanded is twice less responsive to price change in the green demand curve (where value b = 20) than in the red demand curve (where value b = 10). Thus, for example, the green demand curve shows that when the price changes from $4 to $3, the quantity demanded changes from 20 to 40 units of the good or service, a change of 20 units. Whereas on the red demand curve, when the price changes from $4 to $3, the quantity demanded changes from 60 to 70 units of the good or service, a change of 10 units. Essential statement: Changes to the value of ‘b’ results in changes to the slope of the demand curve. It affects how responsive quantity demanded will be to a change in price. |
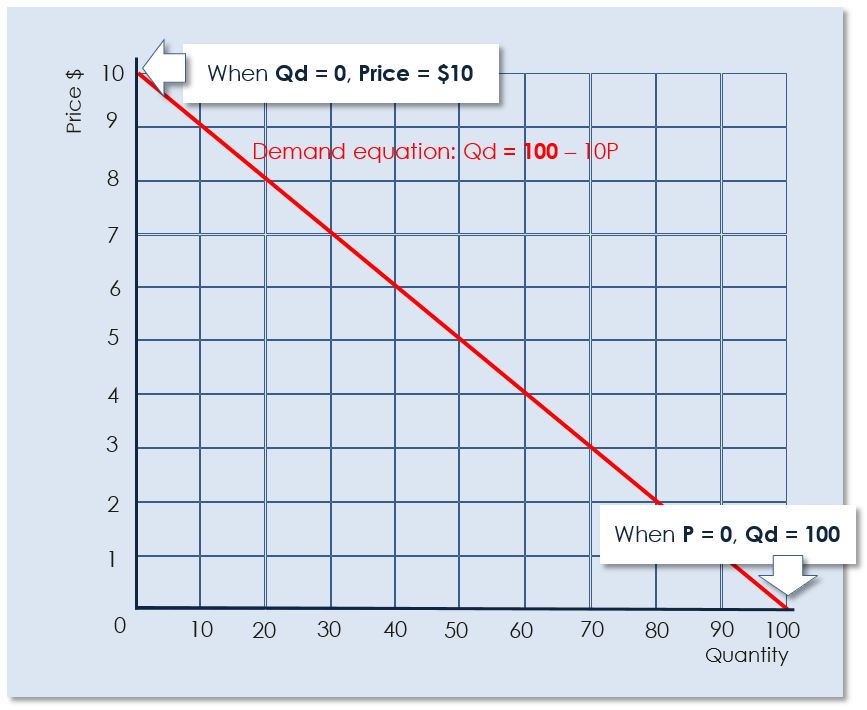
Plotting a demand curve for the demand function
How to shift the demand curve
|
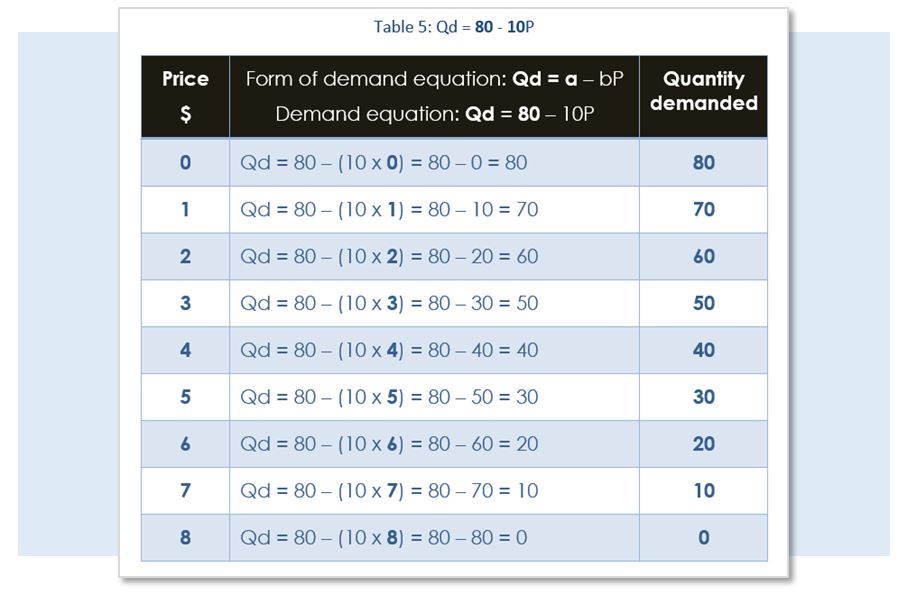
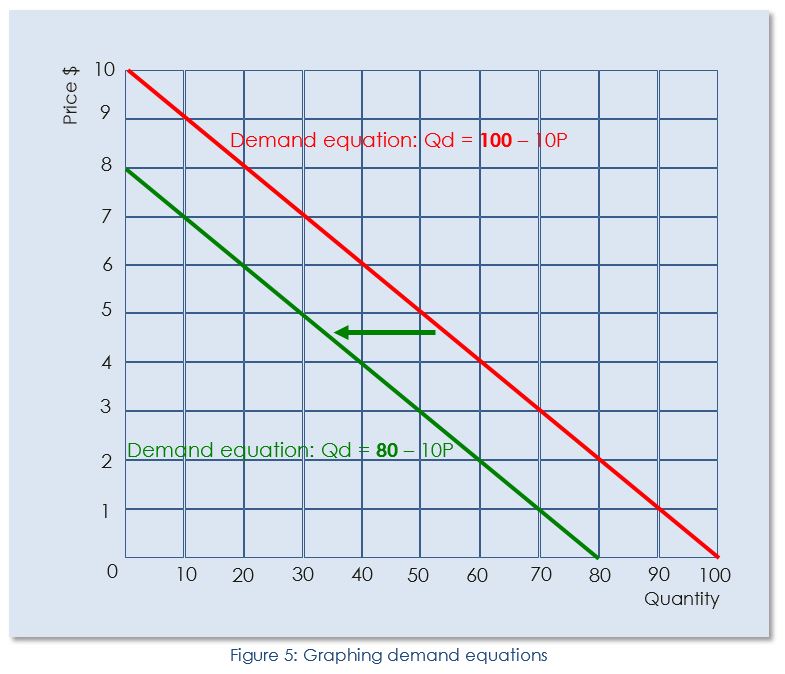
In the demand function shown in Table 4 above: Qd = 100 – 10P. If the value of ‘a’ changes from 100 to 80: Qd = 80 – 10P. The new demand function has new associated quantities demanded at each price, and these are calculated and shown in the demand schedule (table 5) above right.
By graphing the demand functions we can see that the demand curve has shifted down and to the left – demand has decreased. The value of ‘a’ has changed by 20 (100-80), and demand for this good or service has fallen by 20 at each price. We have shifted the demand curve. Essential statement: Changes to the value of ‘a’ result in a change in demand. If ‘a’ increases then demand increases at each price – the demand curve will shift up and to the right. If ‘a’ decreases then demand decreases at every price and the demand curve will shift down and to the left. |
PROGRESS CHECK - TEST YOUR UNDERSTANDING BY COMPLETING THE ACTIVITIES BELOW
You have below, a range of practice activities, flash cards, exam practice questions and an online interactive self test to ensure you have complete mastery of the IB Economics requirements for the Microeconomics – Competitive markets: demand and supply 1.1 Demand topic.
IB Economics interactive QUIZZES AND TWO CLASSROOM GAMES
Test how well you know the IB Economics Microeconomics – Competitive markets: demand and supply 1.1 Demand topic with the self-assessment tool. Aim for a score of at least 80 per cent.
|


